March 21, 2011
-
MIDI Room Tones
So my whole PHP Xbee thing ended up crashing my computer, again! So square one (Well,…
-
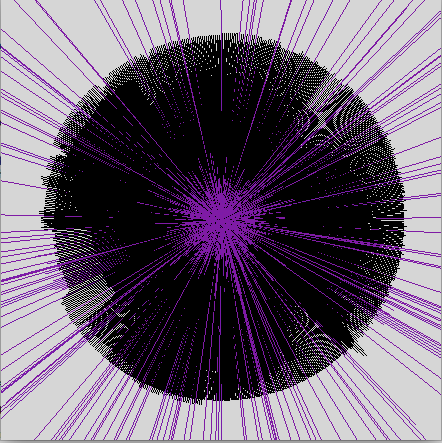
Spring Break Data Viz
This graph is of averages of photocell readings over time. I wrote the data to a…
-

Temperature data during one day
So my Xbees had trouble for a change, and after long hours trying to troubleshoot I…
-
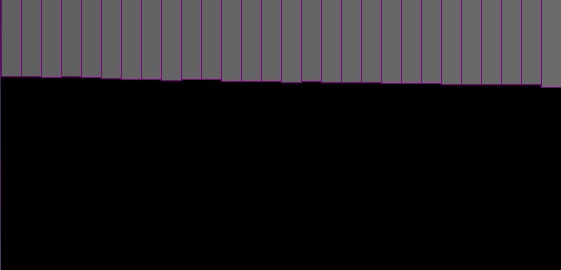
My poor little visualization
Detailed documentation will come soon. I used Pachube to collect data but the API killed me…
-

Emotion Catcher+ Bathroom Electricity Minder
Originally I wanted to make a GSR sensor and connect data from my self. I was…
-

The story of an Hour
Sooooooooooooooo…. Since I was using a microphone as my input and was sampling every 100 microseconds,…
-

-

Temperature Visualization
After collecting LOTS of sensor data I realized that I wanted to create a visualization that…
-
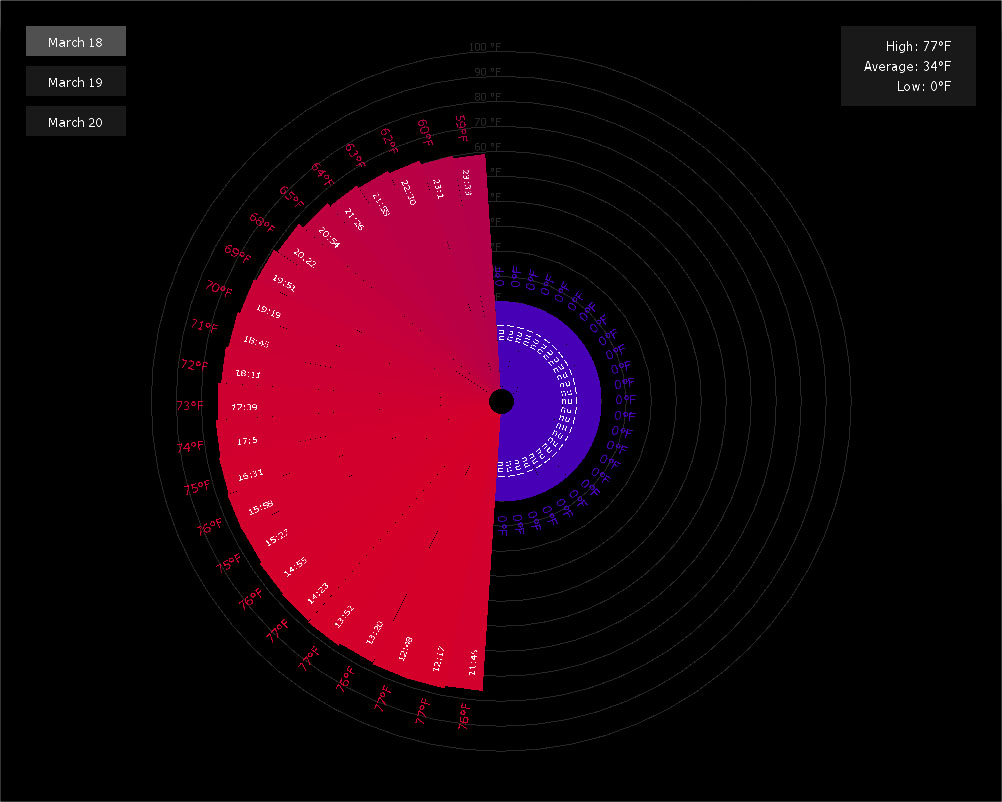
Data logging and visualizing temperature
Second iteration. Now the data is logged and saved to text files for visualizing later and…
You must be logged in to post a comment.