March 10, 2011
-
Ethernet to Server
Writing temperature and light values to a storage file. http://www.piuggi.com/sensorData/storage.txt Php Script put this script on…
-
Takin’ it all the way: Sleep Mode and Direct Activation
Today’s lesson covers two unrelated, but very practical subjects. First off, we’re starting with enabling sleep…
-
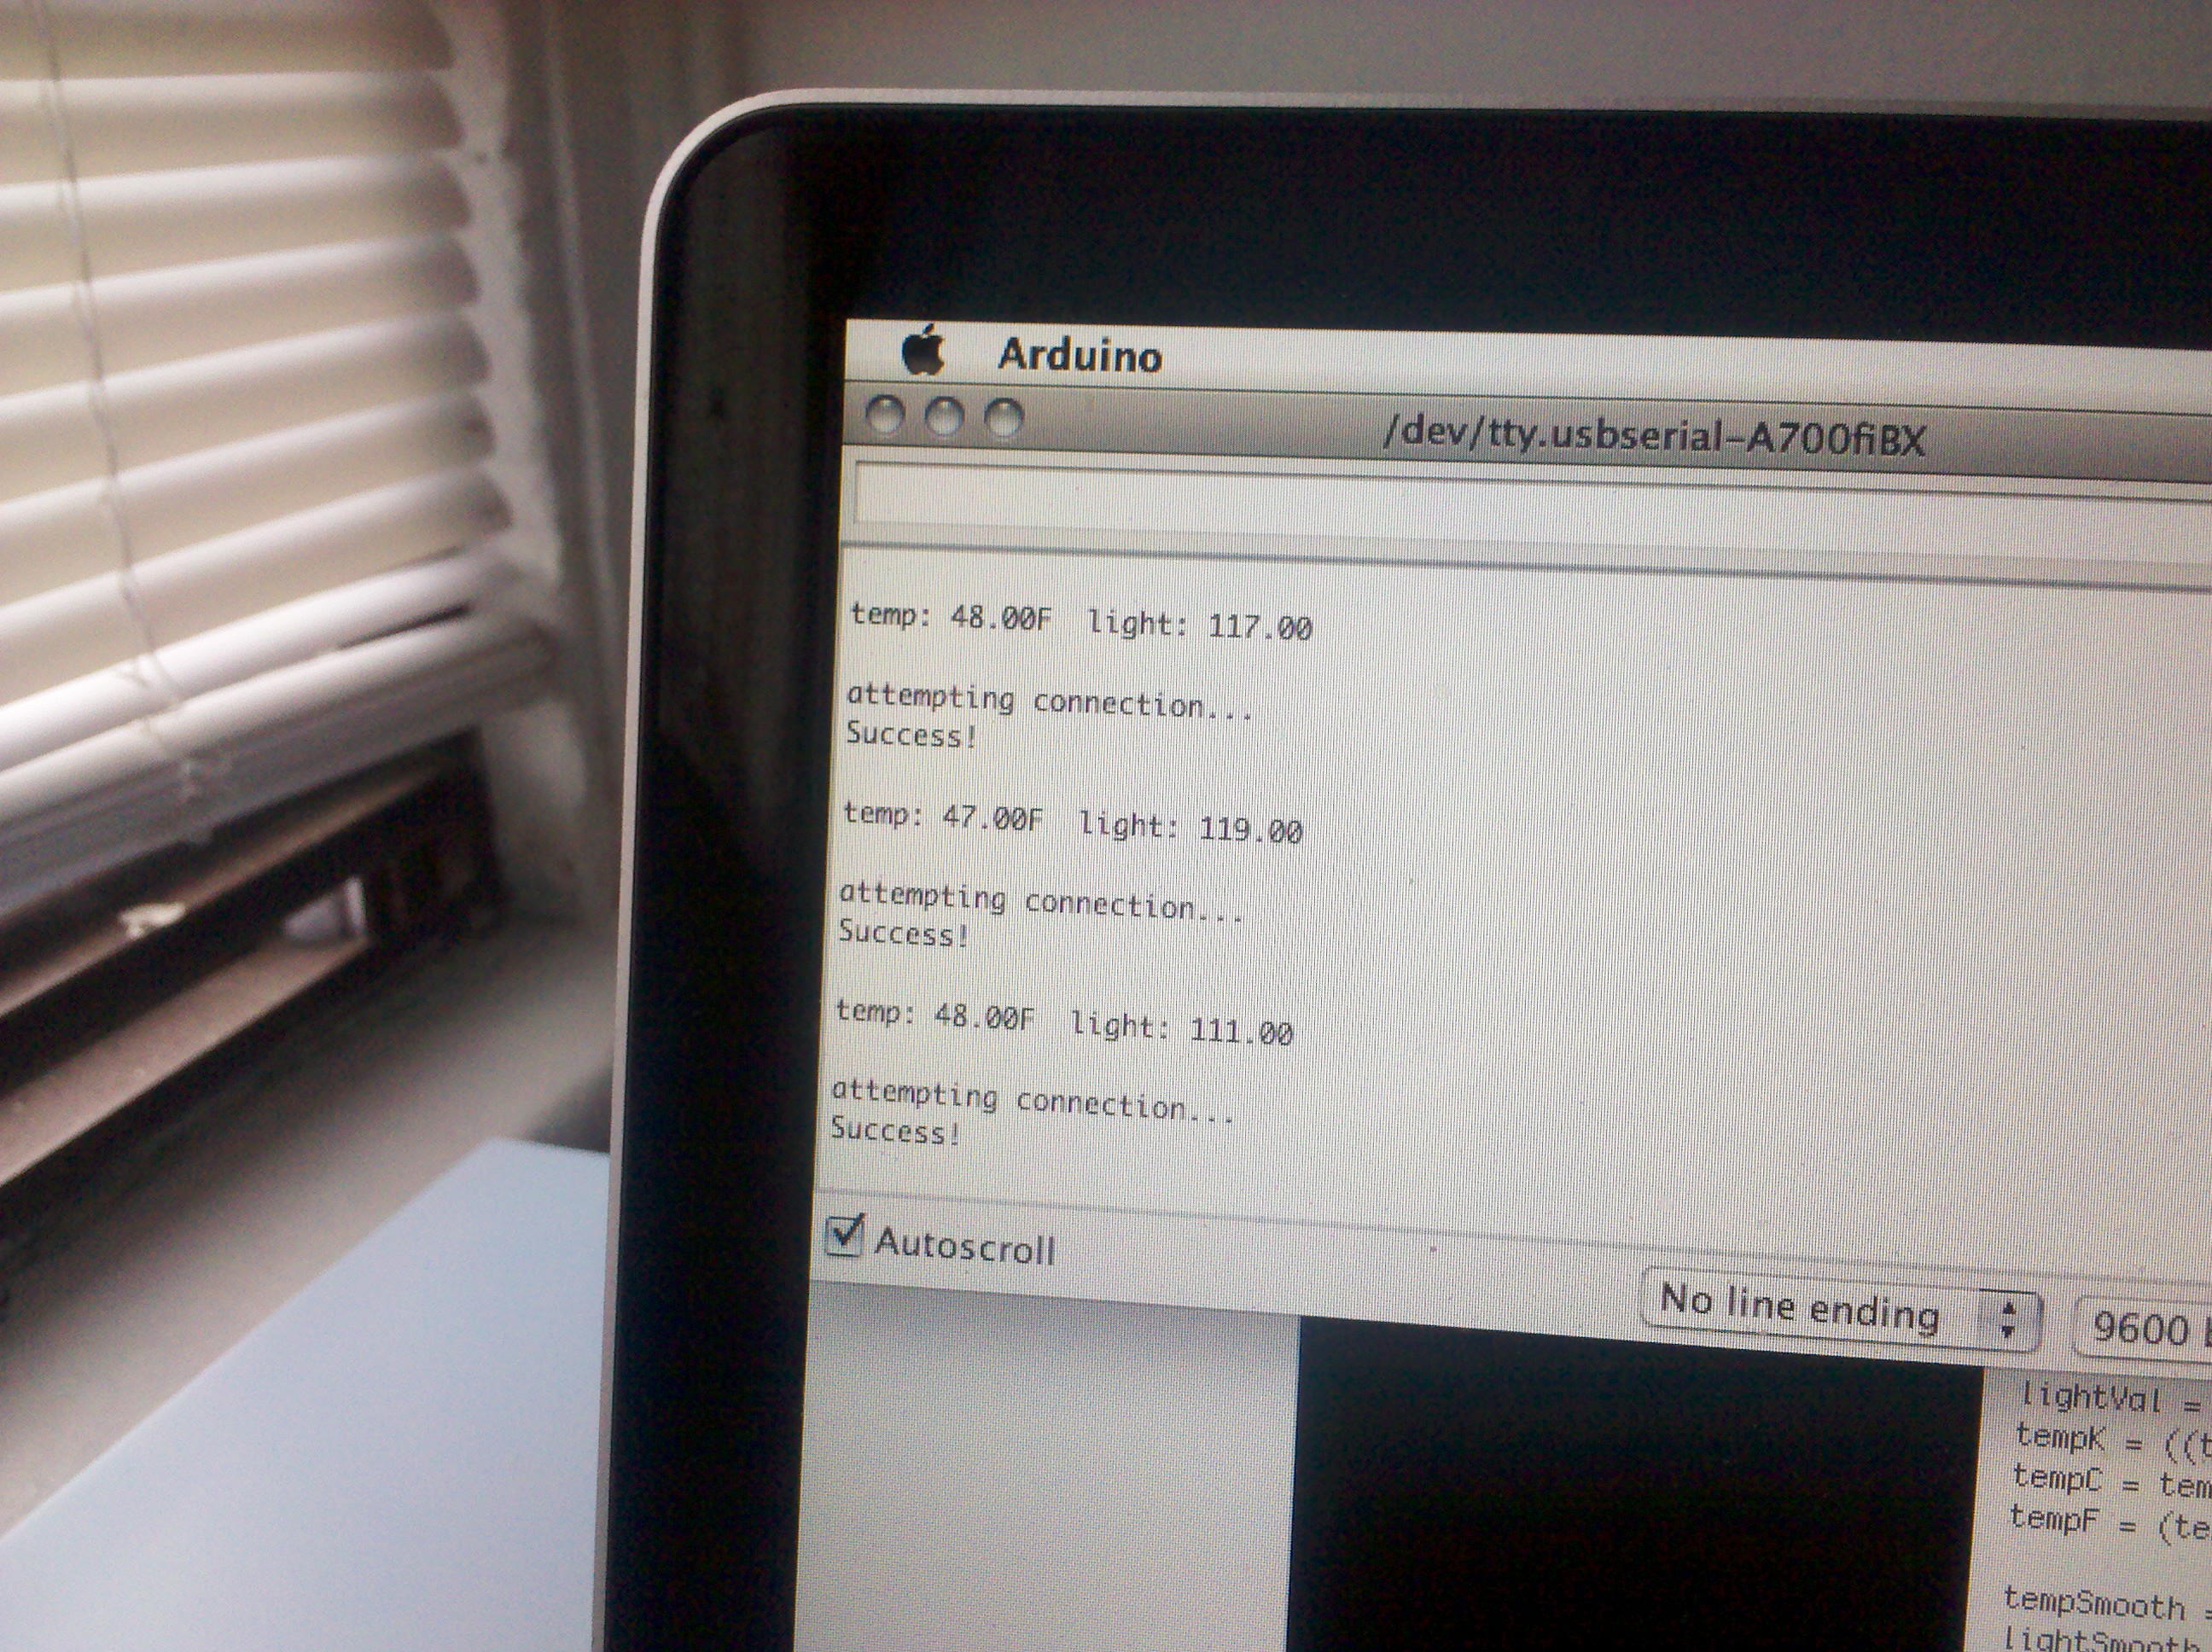
1/2 way there
So I am attempting to talk directly though the xbee coordinator into php, storing to a…
-
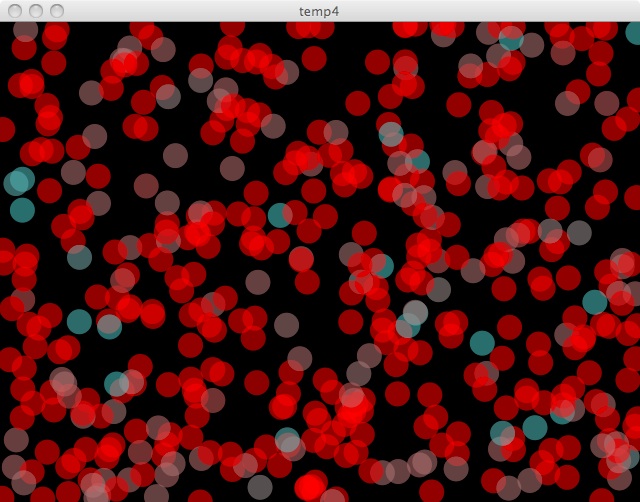
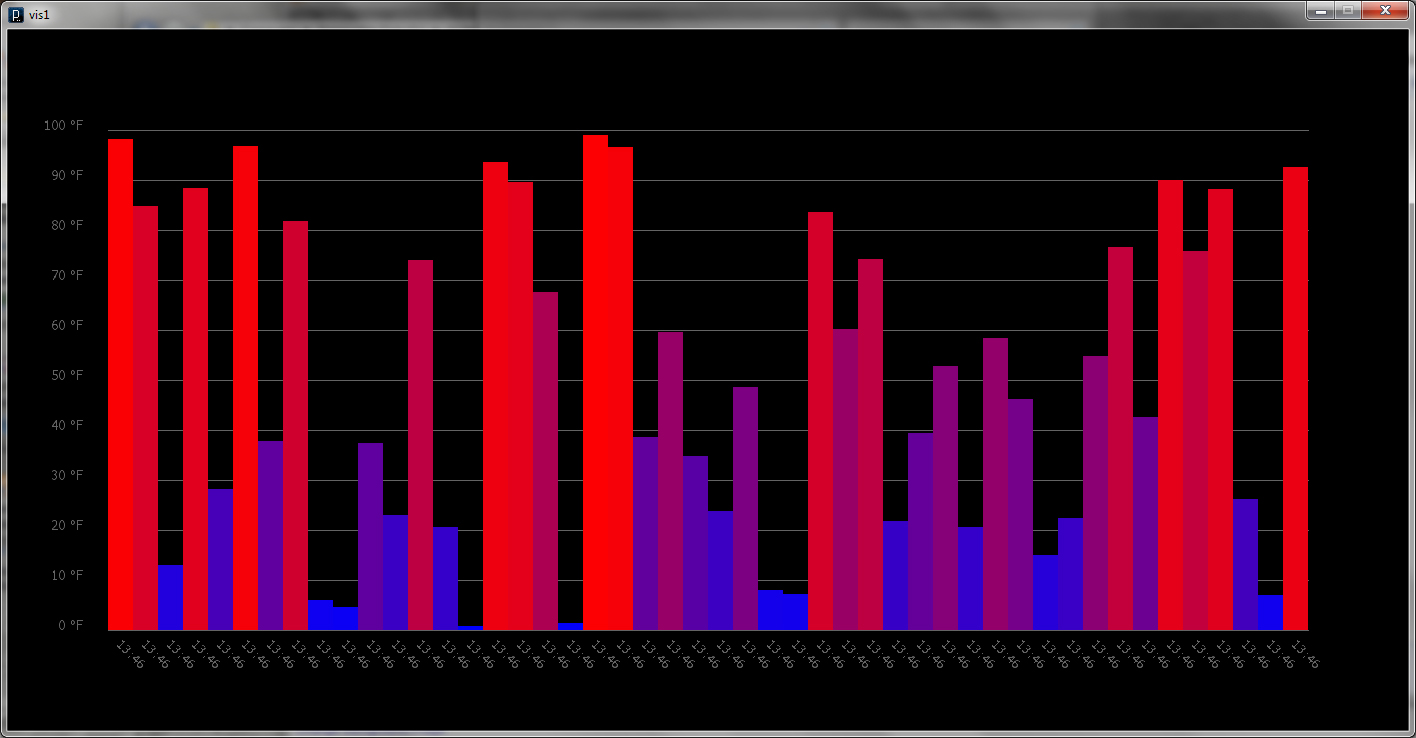
“temperature” sensor graph
(note: “temperature” because I still need to adjust my thermometer, so for this example I was…
-
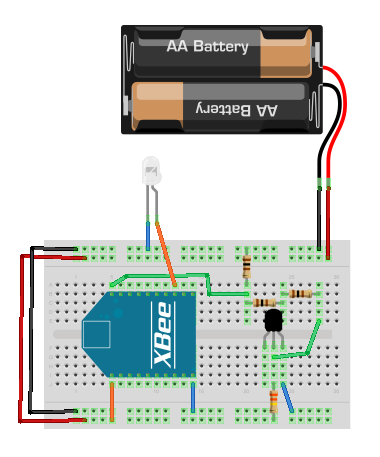
visualizing temperature data part1
This is iteration / step 1. Get some data from a wireless sensor and write some…
You must be logged in to post a comment.