
(note: “temperature” because I still need to adjust my thermometer, so for this example I was using light sensor. a light sensor may be used for the final iterations)
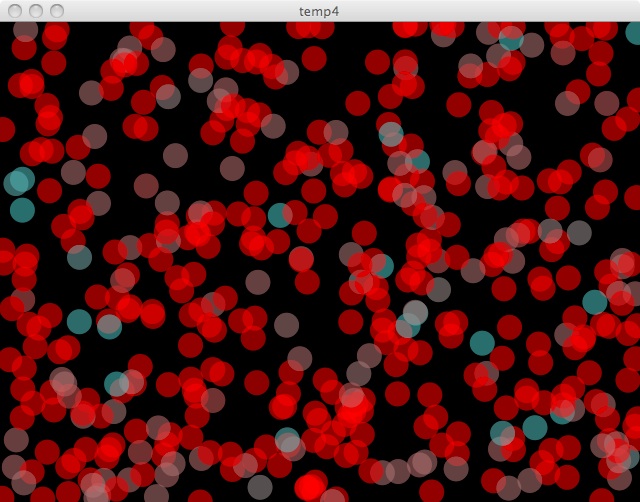
sensor values are plotted to randomly plotted circles’ color. over time this will create a collage of (hopefully) consistent colors. If the temperature sensor is moved around to different climates then it won’t be a consistent color. if I add a light sensor, it’ll get variance from the lights in my room being turned and off. so in theory i should get a nice collage of complimentary colors.
Leave a Reply