My poor little visualization
Detailed documentation will come soon.
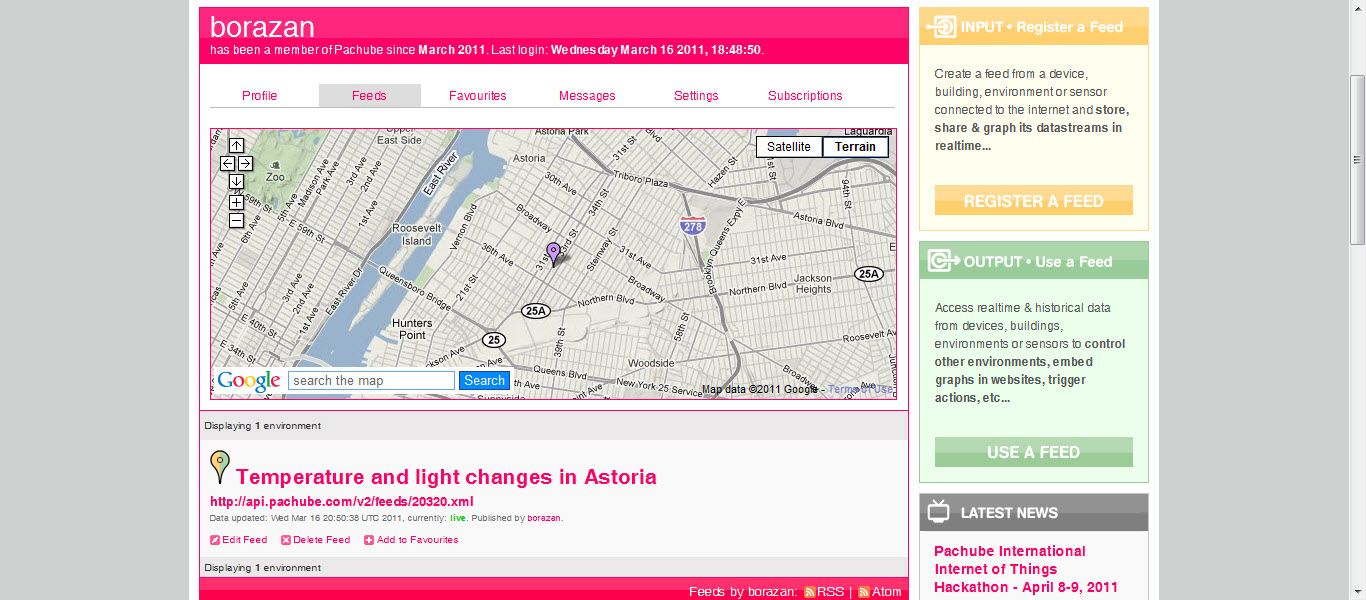
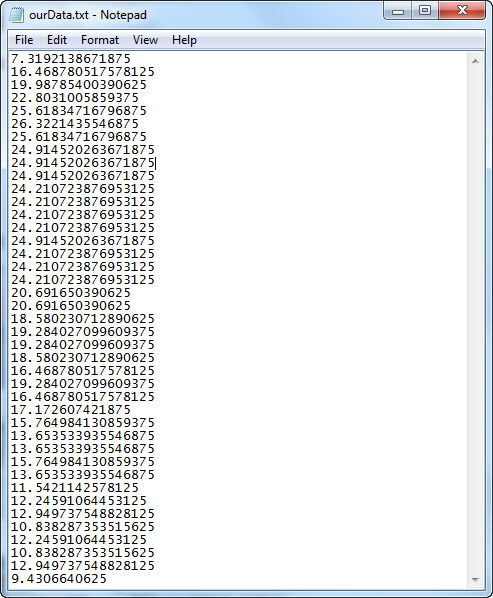
I used Pachube to collect data but the API killed me when I tried to pull data. I couldn’t used the EEML library they offer for Processing, there might be a problem about API version and library. Anyway, I pulled the data to a txt file and visualized that info.

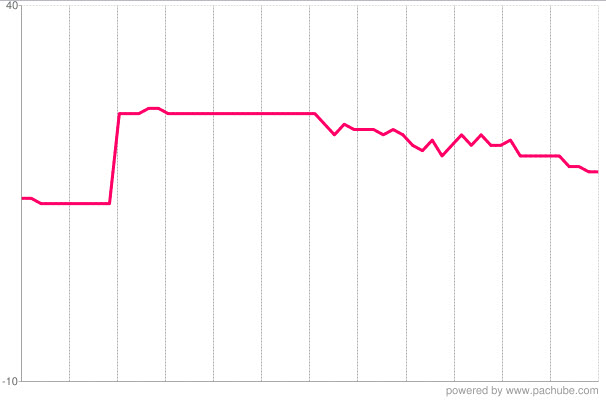
These are my Pachube screens. Sometimes I got disconnected without any reason, sometime I shut down the computer. I made recording for about 3 days with some gaps.


Here’s the source code (Processing):
PrintWriter output;
PFont font;
PImage b;

// The font must be located in the sketch's
// "data" directory to load successfully

color redorangec = color(250, 80, 30);
color orangec = color(250, 140, 30);
color greenc = color(110, 200, 50);
color redc = color(250, 30, 80);
color bluec = color(20, 180, 220);
color darkbluec = color(10, 90, 160);


int x= 0;
int y= 0;
int w= 5;
int h= 5;
float[] values= new float[0];  //holds the recorded values
int[] sensorVal = new int [0];
//ArrayList sensorVal = new ArrayList();

void setup(){
  size(1350,800);
  background(90);
  smooth();

  b = loadImage("flower.png");

  strokeWeight(1);
  //font = loadFont("Calibri-10.vlw");
  font = createFont("Arial", 10);
  textFont(font);

  String[] fontList = PFont.list();
  println(fontList);
}

void draw(){

    readFromFile();

    fill(greenc);
    rect (0,0, width, 120);
    image(b, 55, 35);
    String s = "MY PLANT'S LIVING SPACE";
    String s2 = "Is my location choice good for her?";
    fill (240);
    noStroke();
    textAlign(LEFT);
    textSize(24);
    text(s, 120, 75);
    textSize(14);
    text(s2, 120, 90);


    //---------drawing the coordinate plane
    pushMatrix();
      translate(80,600);
      stroke(200);
      line(0,0,0, width-1800);
      line(0,0, width, 0);
      textAlign(RIGHT);
      textSize(11);
      text("24 hr period", x-5, y);
      text("C°", x-5, y-450);

      pushMatrix();
        translate(0, 15);
          for(int i=0; i<1440; i=i+28){
            fill (150);
            line(i,3, i, y-15);
            textSize(9);
            text("30", i, y);
            text("min", i, y+10);
          }
      popMatrix();


      //----10 degrees level
      pushMatrix();
        translate(-10,-132);
          stroke(bluec);
          line(x+10, y-5, width, y-5);
          stroke(redc);
          line(x+10, y, width, y);
          fill(redc);
          textAlign(RIGHT);
          textSize(12);
          text("10°", x, y);
          text("alarm", x, y+15);
          text("level", x, y+25);
      popMatrix();

      //----16 degrees level
      pushMatrix();
        translate(-10,-217);
          stroke(greenc);
          line(x+10, y, width, y);
          fill(greenc);
          textAlign(RIGHT);
          textSize(12);
          text("16°", x, y);
          text("optimum", x, y+15);
          text("level", x, y+25);
      popMatrix();

      //----21 degrees level
      pushMatrix();
        translate(-10,-300);
          stroke(orangec);
          line(x+10, y, width, y);
          fill(orangec);
          textAlign(RIGHT);
          textSize(12);
          text("21°", x, y);
          text("maksimum", x, y+15);
          text("level", x, y+25);
      popMatrix();

    popMatrix();

//------drawing the circles-----------------------
    for (int i=0; i<40; i++){
         //println(values[i]);

     pushMatrix();
        translate(80,200);
        //scale(6,6);
        noStroke();
            if (values[i] > 21){
              fill(redorangec);
              ellipse(i*30+30, height/2-(values[i]*15), w, h);
             // text(values[i], i*30+30, height/2-(values[i]*15-10));

            } else if (values[i] < 21 && values[i] > 18 ) {

                fill(orangec);
                ellipse(i*30+30, height/2-(values[i]*15), w, h);
               // text(values[i], i*30+30, height/2-(values[i]*15+10));

            } else if (values[i] < 18 && values[i] > 12.5) {

                fill(greenc);
                ellipse(i*30+30, height/2-(values[i]*15), w, h);
               // text(values[i], i*30+30, height/2-(values[i]*15+10));

            } else if ( values[i] < 13 && values[i] > 10){

                fill(bluec);
                ellipse(i*30+30, height/2-(values[i]*15), w, h);
                //text(values[i], i*30+30, height/2-(values[i]*15+10));

            } else {

                fill(redc);
                ellipse(i*30+30, height/2-(values[i]*15), w, h);
                //text(values[i], i*30+30, height/2-(values[i]*15+10));
            }


      popMatrix();
      }
}


void readFromFile(){

    String input[];    //holds the incoming text
    input = loadStrings("./data/ourData.txt");

    for (int i=0; i<input.length; i++){
      float temp=float(input[i]);
      values=append(values,temp);
    }
}

makingtoys 1:26 pm on March 23, 2011 Permalink |
Oylum,
It blows my mind how much work you did for this assignment. Your documentation here needs a little help. Consider it a first draft. Please make another pass at it.
For example, the Pachube work you did alone is amazing. Please provide links to your nodes, or where your nodes were, and/or [well cropped] screen grabs of what it looks like. [Please edit current screen grabs.] Include a photo(s) of your “look and feel” planter prototype. Place 3 of your best (and representative) images Before the “read more” tag. Each image can have 2-4 sentences.
Your work is amazing. Make sure it’s documented correctly, this creates great value for you. Please update this post..
Y.